Maven Airlines Challenge
Link to GitHub repository, including data and final output.
About the dataset
How to play the Maven Airlines Challenge
Import and transform data
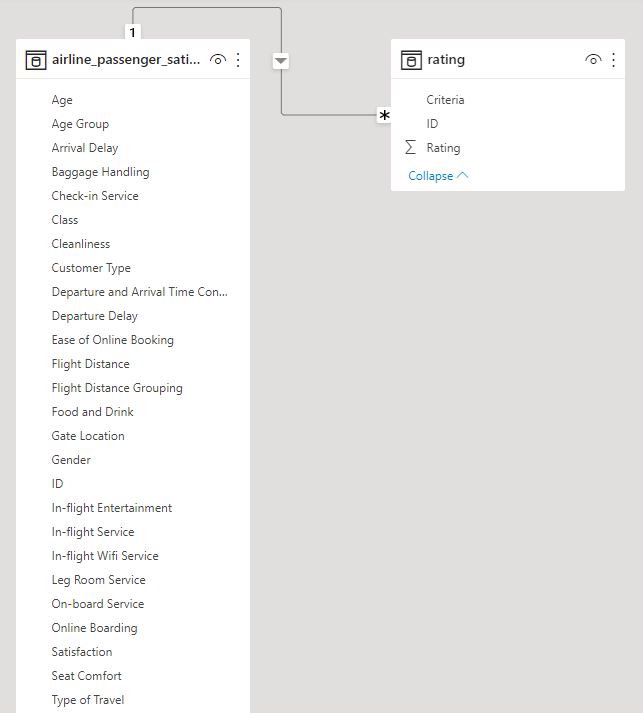
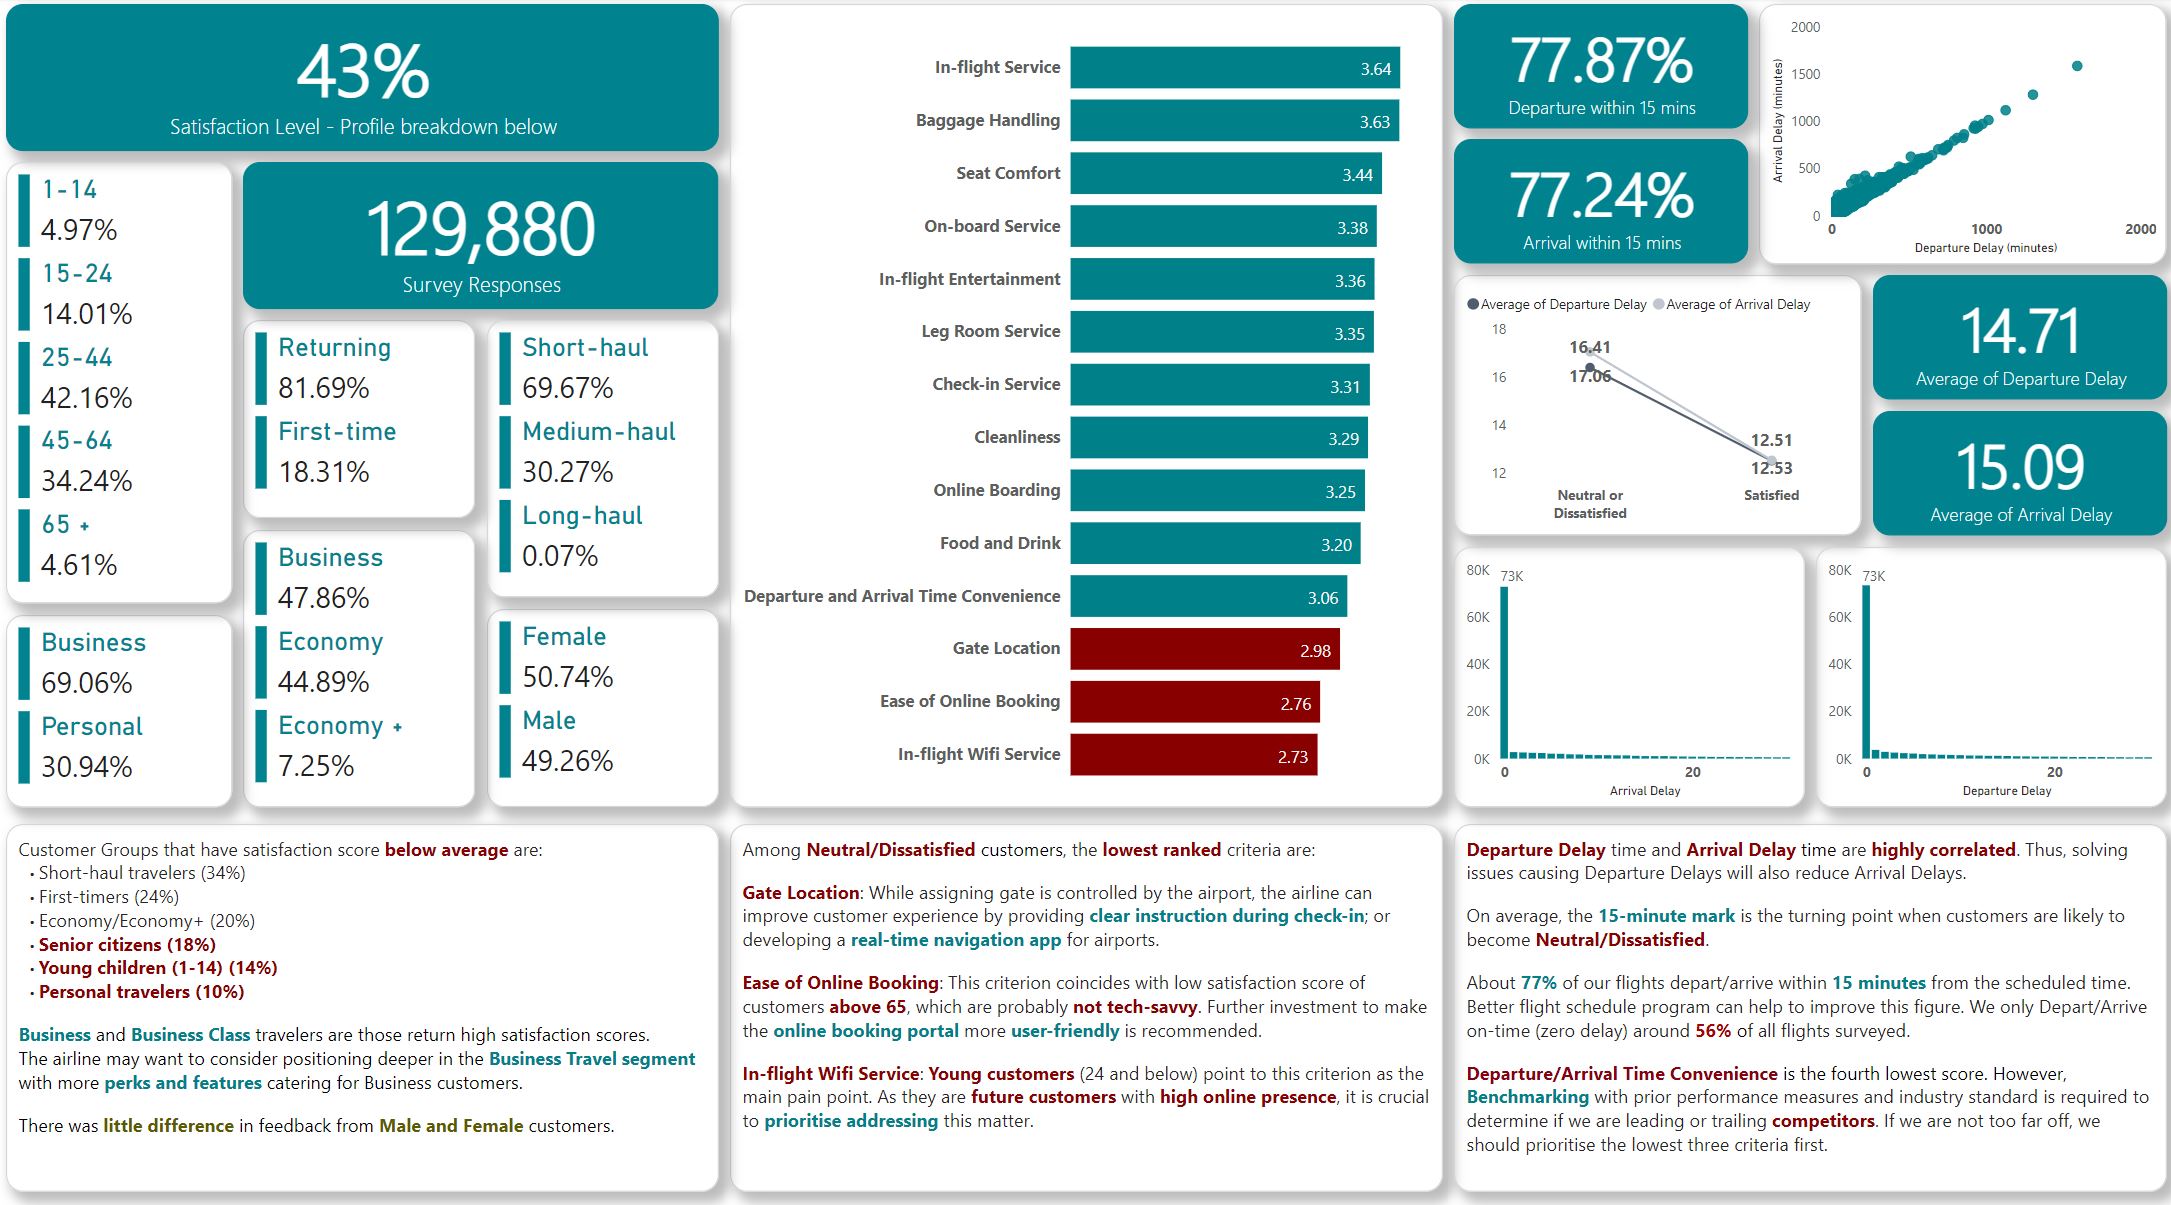
The report template is divided into three sections. From left to right, the first section is a breakdown of customers based on the characteristic columns. This section provides an overview of the customers, also acting as slicer for the rest of the report through the cross filtering function. The second section summarises all the criteria based on their given scores. Cross checking the information in the first and second sections will reveal the linked between poor performing criteria and the relevant customer groups. From here, we can develop tailor solutions to address the bottom criteria. The third and final section looks at time delay to find out more about relationship between delay and satisfaction level.
Customer breakdown
Overall Satisfaction level
Visualisation - Card
Field: New Measure
Satisfaction Level = DIVIDE(
CALCULATE(
	COUNT(
		airline_passenger_satisfaction[Satisfaction]),
		airline_passenger_satisfaction[Satisfaction] = "Satisfied")
	),
	COUNT(airline_passenger_satisfaction[ID])
)Visualisation - Card
Filed: count of ID from satisfaction table
Customer Demographic
Visualisations - Multi row card
Fields: % of count of ID and the characteristic columns
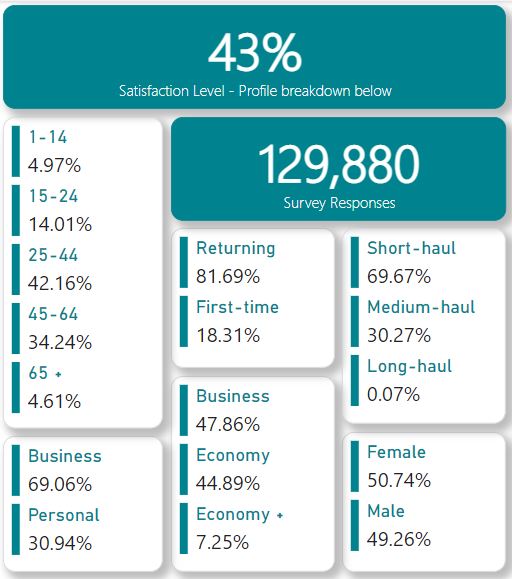
Customer Groups that have satisfaction score below average are:
There was little difference in feedback from Male and Female customers.
Rating Summary
Visualisation - Stacked Bar Chart
Y-axis: Criteria column from rating table; X-axis: average of rating
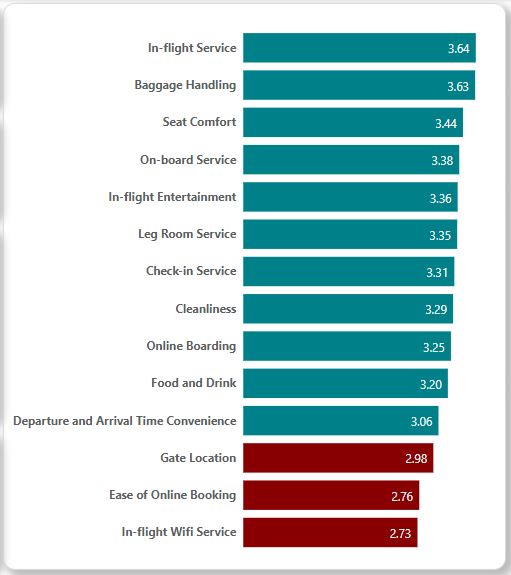
Among Neutral/Dissatisfied customers, the lowest ranked criteria are:
Delay Time Analysis
Correlation between Departure Delay and Arrival Delay
Visualisation - Scatter chart
X-axis: Departure Delay; Y-axis: Arrival Delay.
Insights: Departure Delay time and Arrival Delay time are highly positively correlated. Thus, solving issues causing Departure Delays will also reduce Arrival Delays.
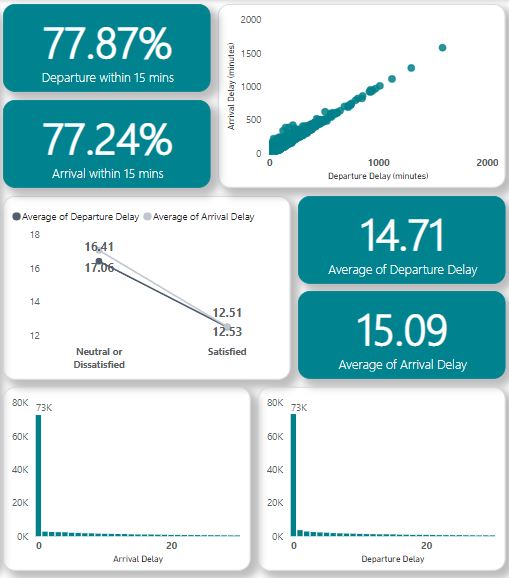
Visualisations - Card
Fields: average of Departure/Arrival Delay time
Delay and Satisfaction
Visualisation - Line chart
Y-axis: average of Departure delay time
Secondary Y-axis: average of Arrival delay time
Insights: The visualisations above demonstrate that, On average, the 15-minute mark is the turning point when customers are likely to become Neutral/Dissatisfied.
Departure/Arrival Delay histograms
Visualisations - Stacked Bar chart
X-axis: Departure/Arrival Delay
Y-axis: vount of Departure/Arrival Delay
The delay times are categorised into groups, each further group to the right represents an addition minute of delay time.
Flights within 15 minutes delay
Visualisations - Card
Fields: New measure:
% departure delay < 15 = DIVIDE(
	CALCULATE(
		count(airline_passenger_satisfaction[ID]),
		airline_passenger_satisfaction[Departure/Arrival Delay] <=15
	),
	CALCULATE(count(airline_passenger_satisfaction[ID]))
)Departure/Arrival Time Convenience is the fourth lowest score. However, Benchmarking with prior performance measures and industry standard is required to determine if we are leading or trailing competitors. If we are not too far off, we should prioritise the lowest three criteria first.